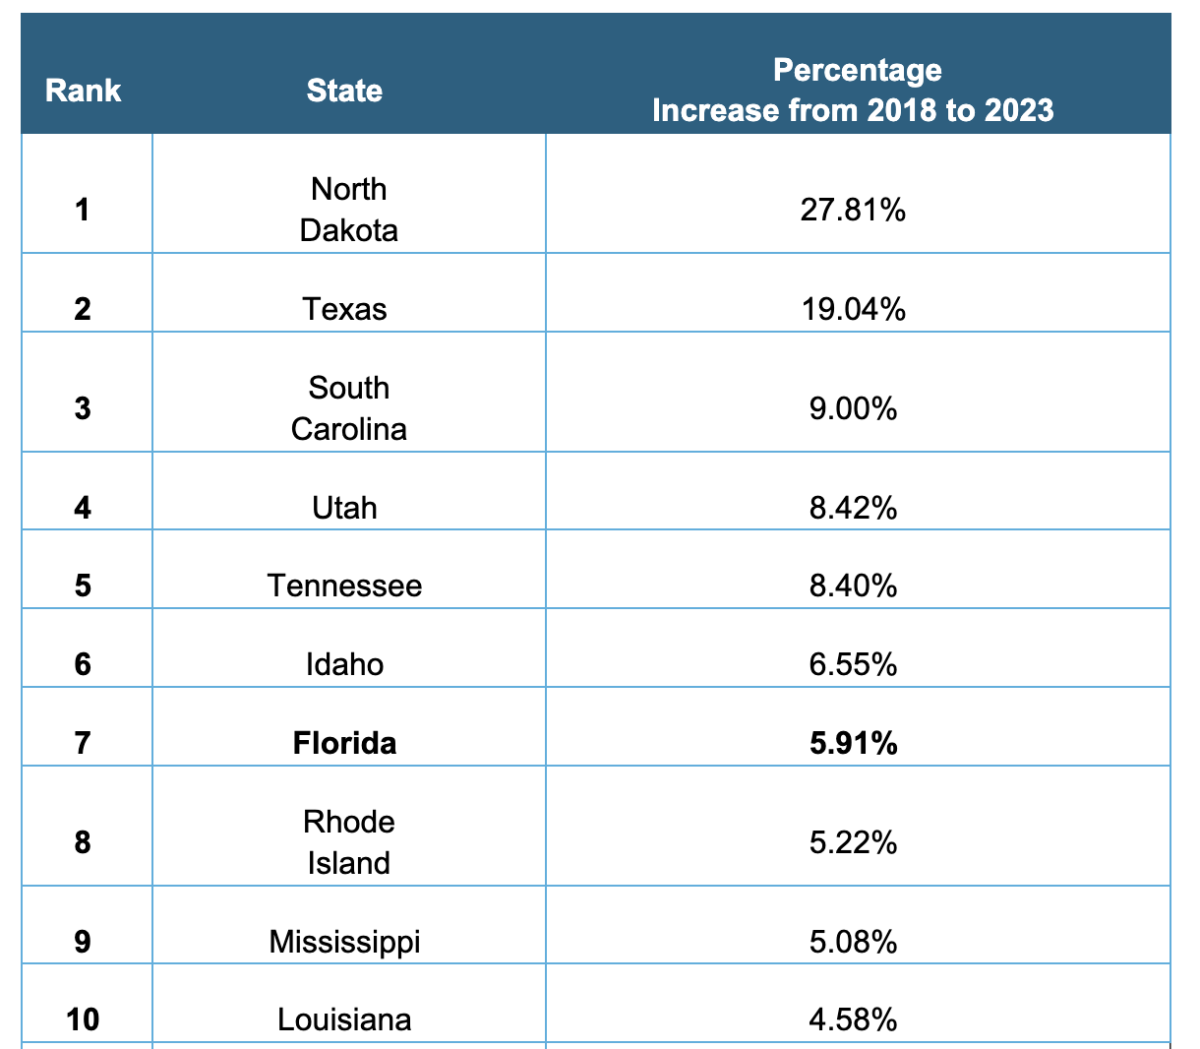
A new study has revealed which states have seen the biggest rise in household debt, with Florida ranking seventh.
Debt relief experts at TurboDebt analyzed household debt data from the Federal Reserve from 2018 to 2023. An average for each year was calculated using both the highest and lowest debt to income ratios in each state, to create the ranking.
North Dakota ranks first, with a massive 27.8% increase in household debt in five years. Between 2019 and 2020, North Dakota experienced the largest debt increase of any state over the five-year period, with the debt-to-income ratio rising by 0.21.
In the last half of 2023, the state saw its highest level of household debt recorded since 2018, reporting a debt-to-income ratio of 1.24.
Texas is second, with debt increasing by one-fifth (19%) in the last five years. In 2018, the lowest debt-to-income ratio recorded in Texas was just 0.4, which then rose to 1.1 in 2023. Between 2018 and 2019, Texas saw an increase in household debt of 12%.
In third is South Carolina, where household debt has increased by 9%. South Carolina has consistently been in the top ten states with the highest average debt-to-income ratio over the five-year period.
Utah is fourth – since 2018, debt has increased by 8.42%. The debt-to-income ratio has increased in Utah every year since 2018, except in 2021 where it was the same. In the last quarter of 2023, Utah recorded the joint second highest debt-to-income ratio.
In fifth is Tennessee, with an overall increase in household debt of 8.4%. Between 2021 and 2023, debt in Tennessee rose by 6.6%.
Idaho is sixth, with a 6.6% increase in household debt over five years. The largest increase occurred between 2022 and 2023, where it rose by 0.05.
Seventh is Florida, seeing an overall increase in household debt of 5.9%. In 2023, Florida had the joint-fifth highest debt-to-income ratio in the US.
Rhode Island is eighth, where household debt has increased by 5.2% over the last five years. The state saw the biggest surge in debt-to-income ratio between 2019 and 2020, where it grew by just over 3%.
Ninth is Mississippi, with an increase in household debt of 5.1%. The debt-to-income ratio high in 2018 was 1.48, but this has risen to a high of 1.55 in 2023.
Rounding off the top ten is Louisiana; in the past five years, the state has seen an increase in household debt of 4.6%. The highest period of growth occurred between 2018 and 2020, where the average debt-to-income ratio increased by 8%.
“The cost of living crisis has impacted people everywhere, including the US. With groceries, rent and energy bills rising, it’s no wonder Americans find themselves falling into greater debt.
“Although some of these states may not have the highest levels of household debt overall, it’s important to note where this debt is on the rise, so actions can be taken to slow the growth.
“The central states seem to be impacted the most, making up half of the top ten, so governments in these areas should be wary of costs beginning to spiral out of control.”
Methodology
Debt-to-income ratios were obtained from the Federal Reserve. Averages for both low and high ratios in all four quarters were calculated to find an average ratio for the entire year.
Average ratios were then compared from 2018 through 2023 to see which states experienced the biggest increase. A full year-by-year breakdown for each state is available on request.


